Using i-Tree Canopy to look at canopy cover
First, what is canopy cover? Canopy cover, which is often also referred to as tree canopy cover and urban canopy cover, can be defined as the area of leaves, branches and stems of trees and shrubs covering the ground when viewed from above. Canopy cover is a two-dimensional metric, indicating the spread across an area.
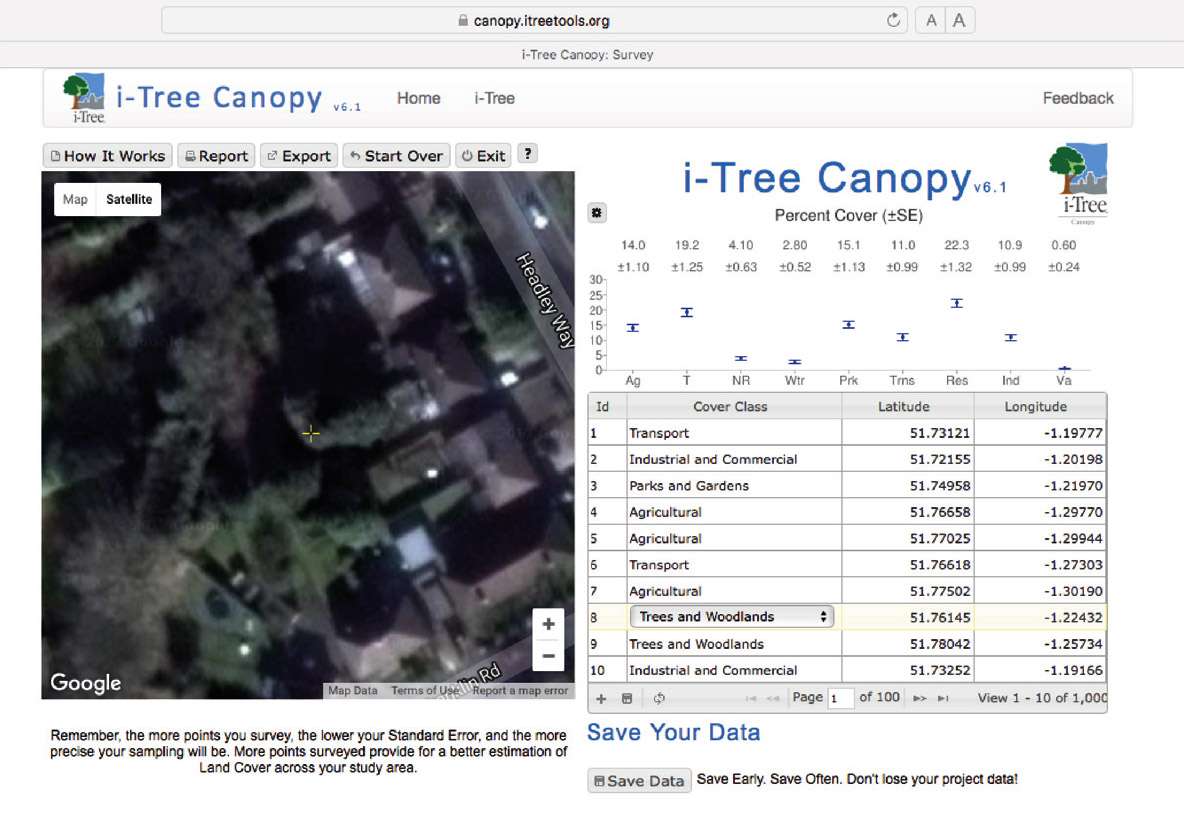
i-Tree Canopy in action: is it a tree or not? Point, shoot, repeat. Around 500–1000 plots will give you an accurate % of canopy cover within 1–2% standard error. The exercise can be accomplished in a few hours.
Secondly, why look at canopy cover? Well, quantifying canopy cover has been identified by many authors as one of the first steps in the management of the urban forest. For example, in James Schwab’s book Planning the Urban Forest (2009), it states:
‘The first step in reincorporating green infrastructure into a community’s planning framework is to measure urban forest canopy and set canopy goals.’
Although city-wide figures are helpful, especially in country-wide projects, tree cover is not uniform throughout a city. Generally, canopy cover will change in relation to landuse, geography and other social and political factors. Quite simply you cannot manage what you haven’t measured.
i-Tree Canopy (other products and methods are available!) is a relatively simple, cheap and easy-to-replicate method to obtain a simple baseline metric.
What can canopy cover tell us?
At a very basic level i-Tree Canopy provides a percentage figure of the amount of tree cover in a given area and could also indicate how much room there might be to plant more trees. However, even this basic measurement can be implemented in a variety of different ways, with varying levels of sophistication and complexity.
Depending on how a project is set up, canopy cover can be assessed at the individual property level, by ward or by borough, through to the city, county or even at country scale.
Forest Research recently completed work on measuring the overall canopy cover for 265 towns and cities across the UK.1 These figures are available at www.Urbantreecover.org alongside canopy figures which have also been calculated by universities, communities and other consultancies.
If your locality is not on there then why not use i-Tree Canopy to find out and add your town?
Establishing a canopy cover baseline is just the beginning. In Australia, for example, they are using the results of a countrywide canopy survey to benchmark and provide a baseline for their aspirations to increase their urban greenspace by 20% by 2020. The study also illustrates which cities have good canopy cover, those which are dominated by ‘hard’ surfaces and grey infrastructure and those where opportunities exist to increase canopy cover.2
Repeated measurements of canopy cover, for instance using historical aerial photographs or repeated surveys, can highlight changes in tree cover over time and space, and studies have been done in Wales, England (see note 2) and the US3 i-Tree Canopy has this functionality using the historical images on Google Earth.
Another way in which canopy cover can be used is to look at correlations between tree cover and the environmental performance of an urban area.
Canopy cover measurements can be used with other data such as crime rates, climate data or health and well-being statistics to provide insight into how urban trees affect – and are affected by – various social and climatic factors.
For example, work in Manchester,4 High Wycombe and Plymouth (reports available at www.Urbantreecover.org) has assessed canopy cover at the ward level and compared this with Office of National Statistics data on things like crime, social deprivation, house prices, healthy life expectancy, acute respiratory disease and mental health. In most cases a clear, positive relationship has been found between tree cover and the other indicators (although causation is not yet proven).
But other uses for canopy assessments need not be so complex. I know of a growing number of communities that have used i-Tree Canopy figures for use in local plans and/or town and village design statements or simply to promote local tree trails.
Hopefully this article has given you an insight into how i-Tree Canopy can be used in a variety of ways for urban forest management, promotion of your work or as an advocacy tool. We really have only just scratched the surface of this fascinating subject.
Parts of this article were previously published by the author in ‘The Axe’ online magazine.
1 K. Doick et al. (2017). The canopy cover of England’s towns and cities: baselining and setting targets to improve human health and well-being. TPBE3 Conference presentation (article in press).
2 Where are all the trees? Available at: www.vision.com.au/research.
3 Nowak, David J., and Greenfield, Eric J. (2012). Available at: www.itreetools.org/Canopy/resources/Tree_and_Impervious_Cover_change_in_US_Cities_Nowak_Greenfield.pdf.
4 Manchester Tree Audit 2. Available at: www.manchester.gov.uk/download/downloads/id/22555/manchester_tree_strategy_2006_-_2010.pdf
i-Tree Canopy is a free-to-use online tool available at www.i-treetools.org
Training resources are also available on the i-Tree tools website. Just one word of caution, i-Tree Canopy also reports on tree benefits values, but these figures have not yet been adjusted for the UK and the accuracy and validity of these estimates is highly uncertain.
If you require further information please get in touch: kenton@treeconomics.co.uk
Article taken for the new look ARB Magazine Issue 178
This issue is digitally available to Members. Although this issue is currently free to view for Non-Members, future issues will be exclusively available to Members so sign up today!
View ARB Mag 178 FREE